
Walkability usually refers to how urban and how likely people are to walk in an area. There are many definitions and metrics for walkability. Urban scientists often measure block size or distance between intersections.
One of the more highly rated mainstream sources on walkability is Jeff Speck with his book Walkable City and more recently, Walkable City Rules .
Speck says that a walk needs to be useful, interesting, safe, and comfortable to maximize the likelihood that people will take it.
WalkScore is another metric that applies to the “useful” metric. It is a number that aggregates the density of amenities for a location. [EDIT: WalkScore contacted me and asked I use their new official link on how it works.] I’ve seen it used in marketing properties as well as academic and market research.
Some of that research has shown that having a higher WalkScore correlates with higher rents or other desirable real estate outcomes .
The question then is how to improve your walkability. It’s a question some cities are asking. Smaller developers and investors looking to improve the value of their properties should be asking it too.
There are two issues at play here: 1) how to improve your WalkScore, and 2) how to improve your walkability overall. These are separate because WalkScore only measures usefulness.
A place can have more amenities but not be comfortable or interesting to walk in. Many strip shopping areas would fall into that category. Or maybe they don’t feel that safe because of a lack of sidewalks or huge parking lots. Part of the walkability survey is qualitative in nature.
Regarding the WalkScore, the easiest way to improve your WalkScore is to go to the WalkScore website and update missing amenities. I’ve found their website to be decent but not nearly as good as Google Maps in terms of having all their amenities in the database.
I recently went and added a list of amenities by looking at Google Maps and adding missing features to WalkScore’s site. They don’t update your score immediately or else you could find out exactly how much they weight each amenity.
When I updated, I added a library, 3 restaurants, 2 theaters, a convenience store, 6 retail stores, 2 schools, 2 pubs, a disc golf park, and an alumni center (listing it as a community center). My WalkScore improved from 54 to 58 about a month later when I checked it again. I got 4 points for about 30 minutes of work. That could have been worth thousands if I’d owned commercial property in the area.
The next way to improve the WalkScore is to add new amenities. That’s part of the development process and a dance between developers, brokers, and city officials.
I separated WalkScore from walkability because there are ways to improve the latter that don’t affect the former.
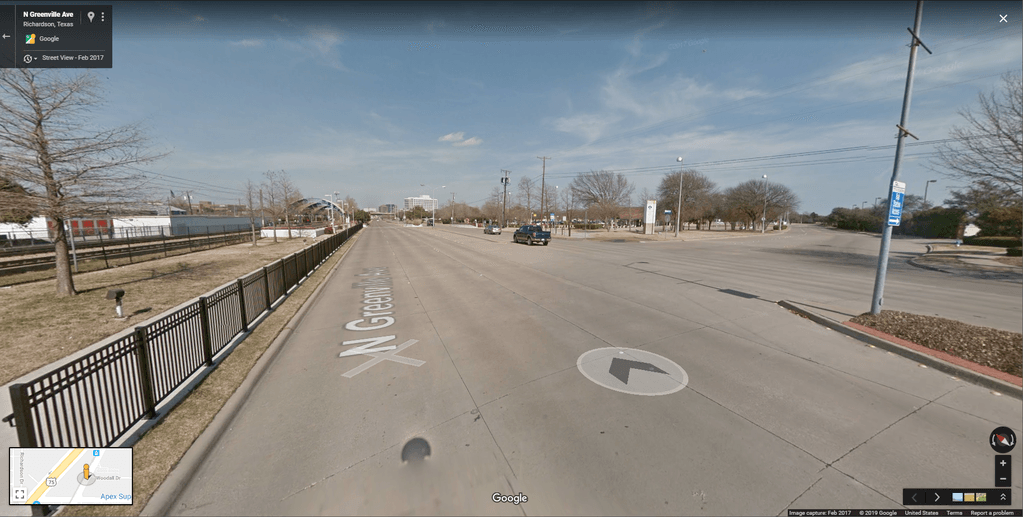
About 20 years ago, our city, Richardson, Texas, commissioned a ULI study related to transportation. Dallas Area Rapid Transit (DART) was installing a rail line through the city and the study was to propose locations. The locations included shuttle service around each location since little of the city is walkable. Overall the city has a 43 WalkScore and that’s after a lot of urban infill since the study.
Most of the rail stops were installed but no shuttle was added. The stops vary from being a large parking lot to being at a huge mixed-use development.
For a GIS Day project, I worked with another GIS PhD student to measure the effect of adding that shuttle service in on walkability. Our underlying assumption was that the walkability benefits of each location accrued to the next because jumping on and off for one-stop wouldn’t require driving.
While riding public transit is not walking, avoiding driving can be a major benefit especially where parking is sparse or residents don’t own cars (like many students at the nearby major university).
I did qualitative surveys of the nearby sidewalk infrastructure including checking for the presence of a sidewalk, distance from the street, railing, tree shade, etc. I checked if there was anything to see on the way (interesting), and gave a subjective rating toward how safe the area felt from traffic and crime.
My partner drew two shuttle routes that connected all the major amenity centers and rail stops. They both met at the middle rail station at Arapaho where the large parking lot is. I’ve included our poster here.
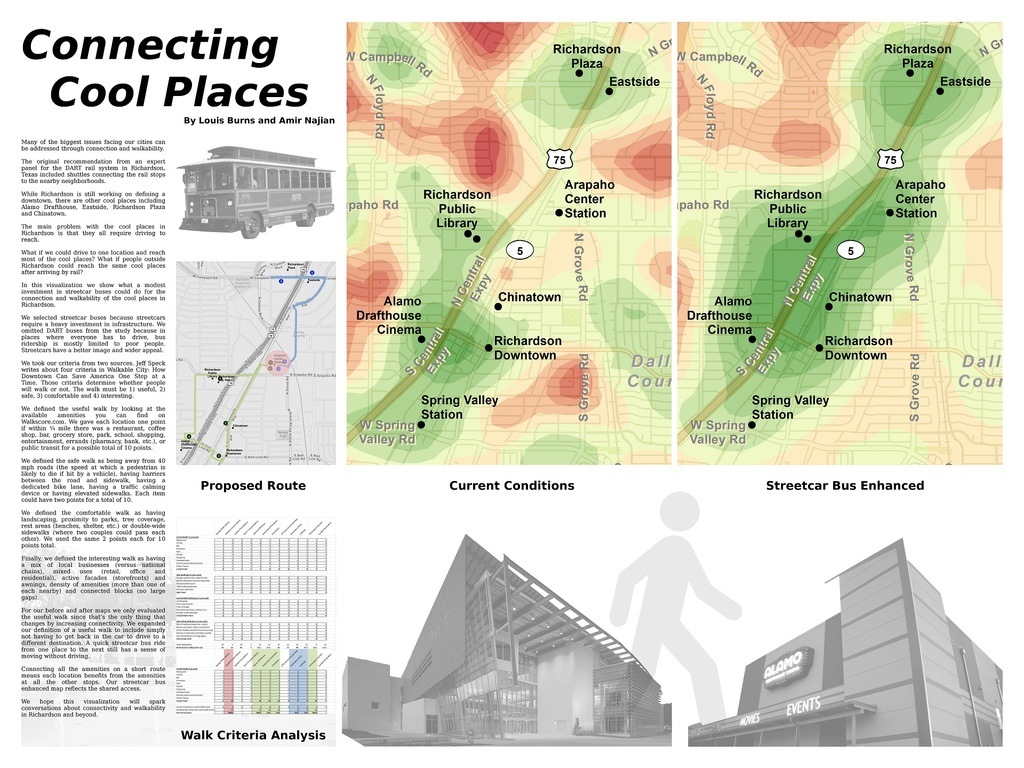
We got second place. I was told we would have gotten first if we had included a legend on the map. I was recently in the program and hadn’t yet learned the dogma about map legends. I was still thinking from a marketing point of view and that a legend would likely have not conveyed very much information and would have cluttered the poster.
Leave a Reply