In my previous article, I discussed gerrymandering in general and how to resolve it. In this article, we’ll take a look at how gerrymandering sometimes works in cities. We’ll take Richardson, Texas as an example because that’s where our organization is located.
At some point in the past, Richardson switched from the worst possible voting system (winner-take-all at-large) to the next worst voting system (winner-take-all single-member districts). This is the way it’s been done typically and is still done in many places so I couldn’t say it was set up in bad faith.
As an additional effect of the winner-take-all system, voter turnout is reduced. Voters justifiably feel their vote doesn’t matter. Researchers refer to wasted votes as votes for a candidate who doesn’t win. Add that to Texas’ voter suppression oriented laws such as having to register a full month before the election, and Richardson has a fairly low voter turnout.
It was pointed out to me that I should be counting the voter turnout rate by the registered voters rather than the population as I had. I feel using the population shouldn’t be too controversial since the voters end up representing the entire population.
But I see why people count registered voters. For one, it boosts the numbers. I prefer to count eligible voters though since not registering is a way of registering your engagement preference or ability. It also registers some amount of voter disenfranchisement.
The most contested place in the 2019 city election was for Place 3 which went to a runoff and had 6,565 voters. If we’re calculating rate by the population we get 5.9% out of the 2017 ACS population of 111,055. If we use the adult population, we get 86,075 which gives us a 7.6% turnout. If we use the registered voter count of 63,359 then we have a 10.4% turnout.
Interestingly enough, Place 3 that went to a runoff had 3,866 total votes in that second vote. That city councilmember was elected by just 82 more votes while she received almost 500 more in the previous general election.
The city council of Richardson is made up of 6 places and a mayor. Four of the six must live in their respective districts that make up Richardson as a nod toward incrementally fairer elections. But all members are still winner-take-all which has sometimes led to the typical dirty politics associated with many city elections.
It’s unclear that the four districts that make up Richardson were intentionally gerrymandered (see map below). Usually, the evidence, if any, is found in the misrepresentation of political parties. Since cities are generally not part of political parties, councilmembers usually don’t identify that way formally and there’s no way to determine underrepresentation.
[UPDATE: A resident of Richardson wrote about the districting process back in 2012.]
The metric to investigate then is whether the council is reflective of the ethnicities present in the city as well as gender-balanced. According to city-data.com, Richardson has these proportions of ethnicities as of 2016 out of a population of 113,368:
- 51.8% White alone
- 16.7% Asian alone
- 16.7% Hispanic
- 10.3% Black alone
- ~4% Other
In a city with 6 councilmembers (1/6 = 16.7%), we would expect proportional representation to include 3 White, 1 Asian, 1 Hispanic, 1 Black (60% chance), and a half to be women. What we currently have is 6 White including 1 woman.
Some additional casual observations include that Richardson has an abundance of hookah lounges (maybe 10), an abundance of Mediterranean restaurants (usually Middle Eastern), and is home to the Chinatown for all of Dallas-Fort Worth. Still, we have no representation of any of those populations on our city council.
Furthermore, I wanted to see whether the four districts might be disproportionally minority populated. Most of the ethnic retail activity are in Districts 1 and 3 and I wanted to see if that was reflected in the populations.
I downloaded the Census data population for Richardson and the physical city boundaries and districts from the city. The Census data I used was the American Community Survey, Hispanic or Latino by Race, 2017 ACS 5-year estimate block groups for Dallas and Collin counties since Richardson spans both.
Then I used QGIS to reduce both counties down to the blocks that were in Richardson. There is one block in the northeast tail that covers more than just Richardson but by and large, I think the estimate margins of error (MOE) were larger than that half-block would effect. In glancing at the MOEs, I saw one error that was as high 99 for a block of 193 people.
I used an R script to clean all the raw data fields down to the ones I wanted to use. I then joined that data to the Tiger Line File Block Groups polygon data. Finally, I did summary statistics (i.e. total count) to see how many of each population were in each district.
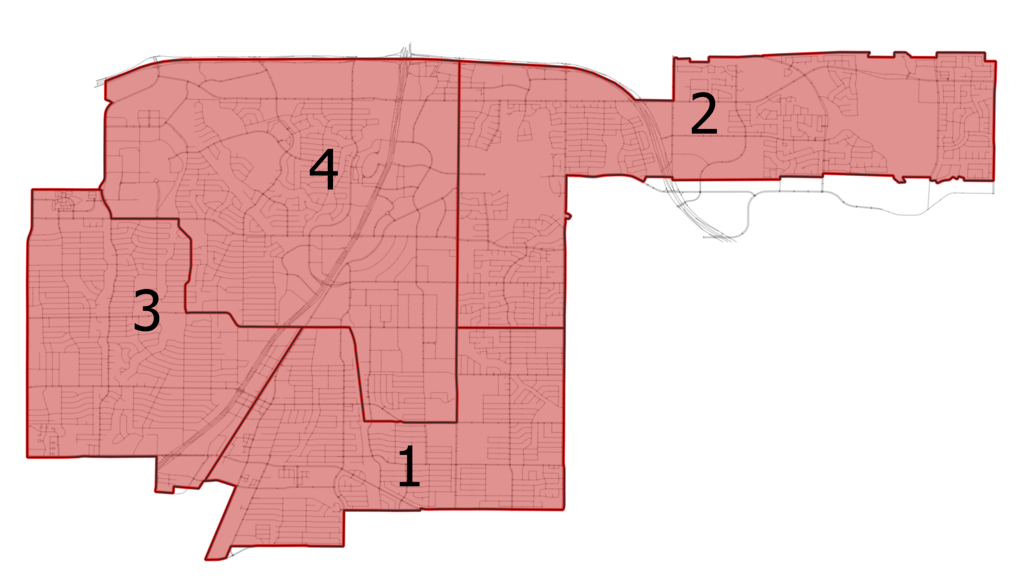
| District | Population | Percentage |
| 1 | 22,829 | 25% |
| 2 | 13,209 | 15% |
| 3 | 26,754 | 29% |
| 4 | 28,091 | 31% |
| Total | 90,883 | 100% |
What we see in this table (the margins of error notwithstanding) is that District 2 has about twice as much representation on the council (1 councilmember for half the population). When the districts were drawn back in 2012, the ideal population was 24,805 based on page 46 of this document. It seems unreasonable to conclude that any district diminished in population to the degree that District 2 has.
Additionally, when we look at minorities, we see this:
| District | Minority |
| 1 | 67% |
| 2 | 57% |
| 3 | 63% |
| 4 | 61% |
I was surprised to see this result given the aggregated Census data says the total population is 52% White. The first conclusion I drew was that I might have made a mistake. I double-checked my work and then checked the published margins of error to see that they can be fairly large. But until we get the 2020 Census results, these are the best numbers. They are the 5-year estimate which is supposed to be the most accurate the ACS has.
If we assume that the margins of error are roughly evenly distributed then these numbers are still interesting to discuss. It’s still hard to believe that District 2’s total population is correct so we’ll skip to the racial makeup.
Most interesting, District 2 has the lowest proportion of minorities. If the population total data has any reflection in reality then that would be concerning.
Secondarily, District 3 has 33% Hispanic to the 37% White population. Those numbers aren’t shown in the table above but were from the data I aggregated.
If we wanted the most representative voting system in Richardson, we would go to a ranked-choice or cumulative voting system. If we wanted a system that was fairer but not quite that fair, we would have to redraw the districts and implement a multi-member ranked-choice system.
The way that could work is that every district would get two (or three) members. If we used straight ethnicity and gender as markers, a representative outcome would have one white and one minority from each district and be gender-balanced overall.
If we take the numbers that Richardson has 17% Hispanic and Asian and 10% Black, then we would want 6 or 10 or 12 members on the council so that every population would have representation.
But as we saw in the previous article, it’s not possible to draw fair maps. And neither does every minority vote for the same candidate who shares their minority or gender background.
Before finishing this discussion, let’s look at the case of Richardson ISD (see map below). It was a more obvious case of there being a larger population of minority students but having no minority representation on the school district board. And the arguments related to unequal funding are substantial.
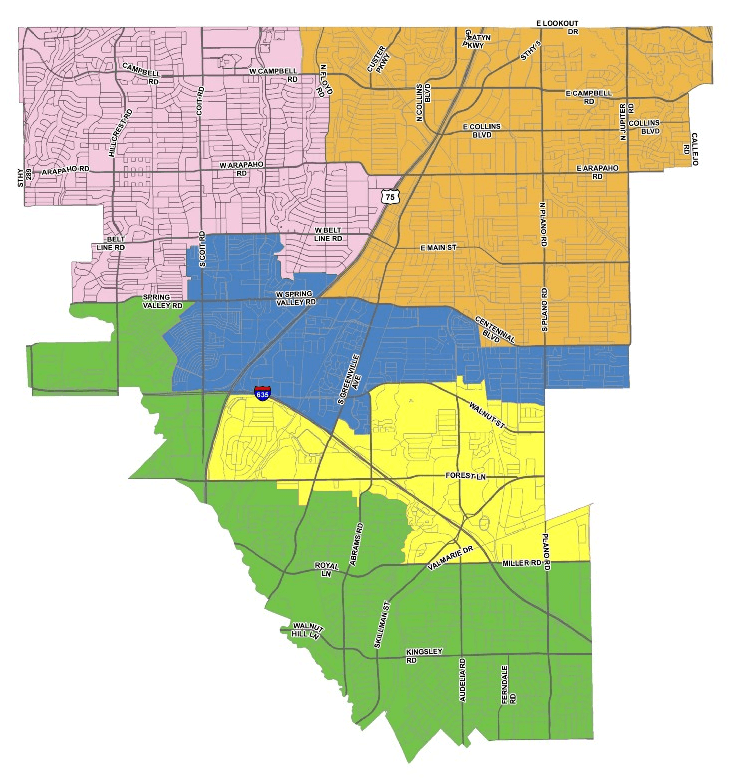
The district represented in green is most of south Richardson and some of North Dallas. It suspiciously stretches across the whole southern border of the district as you would expect a gerrymandered district to do. Above it are two rather compact districts which seem okay if you don’t know about the demographic characteristics.
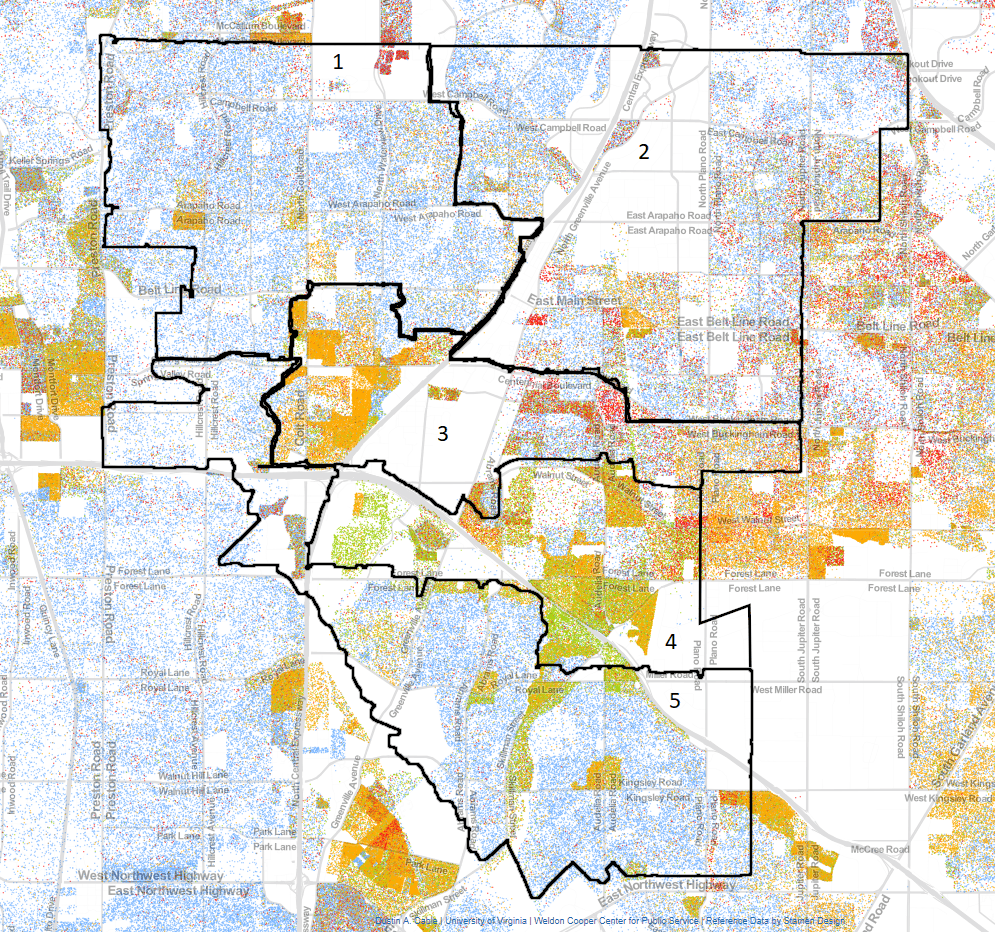
The green district is mostly made up of White students. The yellow district is mostly Black students. And the blue district is mostly Hispanic students on one side and Asian students on the other. I superimposed a racial dot-map over the district borders at one point to look at it.
As these situations typically go, a former board member sued the district and hired a gerrymandering expert attorney. The judge of course ruled in the favor of voters needing to have more candidates of their choice (i.e. minorities).
So rather than getting a fair voting system such as ranked-choice, RISD is getting a new gerrymandered map in favor of the minority groups. It is unclear that this result will be better for the school district though it will make some people feel that it is.
The better result would have been a better voting system, not a different map.
So it goes with Richardson. It seems clear from the tables above that the whitest district has twice the representation of the others. That should not be if we care about representative government. The solution is ranked-choice voting, not another well-intentioned but gerrymandered map.
UPDATE 8/1/19: Edited to reflect better numbers for voter turnout and clarify wasted votes concept.
UPDATE 8/2/19: Edited to reflect 2012 redistricting process.
Leave a Reply